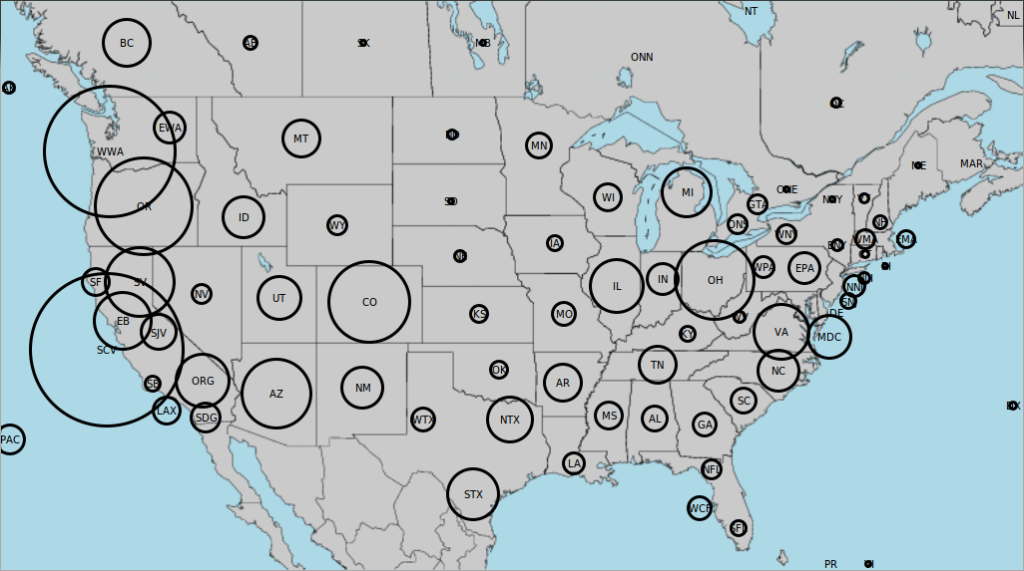
John AC6SL analyzed the field-day logs and created a map of contact counts. Each section worked is represented by a circle that is centered on the section code. The width of each circle indicates the relative number of contacts in the logs for the associated section. (Click the image to enlarge it.)
Contact Map for 2013 Field Day
July 30, 2013 by
